Homeownership, income, and jobs in the Delta have steadily improved in recent years, supporting regional quality of life and regional infrastructure.
The Measure
Improvements in the Delta economy that include a mix of agriculture, tourism, recreation, commercial and other industries, as well as vital components of state and regional infrastructure expressed in the Regional Opportunity Index (ROI) within the Delta.
-
Expectations
Delta economy measured by the Regional Opportunity Index (ROI) integrating economic, infrastructure, environmental, and social indicators are improving.
-
Performance Metrics
- Regional Opportunity Index (ROI) for People and Place, in the Primary Zone and Secondary Zone (score), evaluated every five years.
Economy Metrics (more details below)
| Metric | Definition |
|---|---|
| Education Level | Residents with completed high school education |
| Education Revenue Per Student | Revenue schools receive per student from the state |
| Median Household Income | Median of all household incomes |
| Homeownership | Homeownership rate |
Economy Metrics (more details below)
| Metric | Definition |
|---|---|
| School District Poverty | Rate of children (ages 5 to 17) in families with income below the poverty line |
| Unemployment Rate | Unemployment rate |
| Home Value | Median home value |
| Road Conditions | Pavement conditions rated by the California Department of Transportation |
A vital Delta economy supports a mix of agriculture, tourism, recreation, commercial, and other industries in the Delta, as well as vital components of state and regional infrastructure, and improving conditions for disadvantaged communities.
The Delta Protection Commission (DPC) worked with the UC Davis Center for Regional Change to apply the Regional Opportunity Index (ROI) to the Delta. ROI incorporates both a "people" component and a "place" component, integrating economic infrastructure, environmental, and social indicators into a comprehensive assessment of the factors driving opportunity. The goal of the ROI is to identify people and places with the greatest needs. Decision makers can use this information to target resources for fostering thriving communities for all Californians.
ROI includes indicators for education, local economy, housing, transportation infrastructure, health care services and civic engagement and allows for comparison with regions of interest (local, regional, or state). Tracking this index will aid our understanding of Delta community needs.
Eight indicators were selected that closely match the no longer maintained Regional Opportunity Index (ROI), the designated metric for this performance measure in the Delta Plan. Source: U.S. Census Bureau. The following is a description of each:
Education Level: The rate of residents with completed high school education is indicative of increased labor market participation and job competitiveness which in turn often correlates to high-skill jobs and high wages. This percentage is not a percentage of the state average, just the Delta average.
Education Revenue per Student: The cost-adjusted revenue per student is the revenue schools receive per student from the state and indicates available school district funding. It allows for an understanding of how much a school district can spend on necessary resources.
Median Household Income: Median household income represents the middle number of all household incomes in an area and is indicative of the region’s standard of living and prosperity.
Homeownership: The rate of home ownership to home rental indicates the stability of the housing market and the financial capability of the population. High homeownership rates indicate a population that is financially stable and invested in their community.
School District Poverty: The school district poverty rate tracks children ages 5 to 17 who live in families with income below the poverty line. School district poverty rates indicate educational access and socioeconomic opportunities for young people in the region.
Unemployment Rate: The unemployment rate indicates the number of employed individuals as well as the size of the labor force and reflects the economic health of the region. A low unemployment rate indicates less competition for existing jobs and often correlates with higher household incomes.
Home Value: Median home value indicates the affordability of houses in the region.
Road Conditions: Road pavement conditions indicate the quality of the interstates, freeways, and highways in the Delta and represent a measure of Delta’s transportation infrastructure. This percentage is not a percentage of the state average, just the Delta average.
Each chapter of the Delta plan includes strategies to achieve the goals of the plan. These strategies are general guidance on achieving the objective laid out in the plan and in the Delta Reform Act of 2009. Associated with these strategies are recommendations. The recommendations describe more specific and implementable actions to support the achievement of Delta Plan strategies. Strategies may also have associated performance measures. Delta Plan performance measures track progress in achieving desired outcomes for the Delta Plan. Below are the strategies and recommendations associated with this performance measure.
Delta Plan Strategy
- Sustain a Vital Delta Economy
Delta Plan Recommendations
- Support the Ports of Stockton and West Sacramento
- Plan for Delta Energy Facilities
- Promote Value-added Crop Processing
- Encourage Agritourism
- Encourage Wildlife-friendly Farming
- Plan for the Vitality and Preservation of Legacy Communities
- Buy Rights of Way from Willing Sellers When Feasible
- Provide Adequate Infrastructure
- Plan for State Highways
- Subsidence Reduction and Reversal
- Provide New and Protect Existing Recreation Opportunities
- Encourage Partnerships to Support Recreation and Tourism
- Expand State Recreation Areas
- Enhance Nature-based Recreation
- Promote Boating Safety
- Encourage Recreation on Public Lands
- Enhance Opportunities for Visitor-serving Businesses
- Provide Public Access on Appropriately-located Delta Levees
Metric
Evaluated every five years, Regional Opportunity Index for People and Place (ROI), in the Primary Zone and Secondary Zone (score).
Baseline
Measured as of 2012.
Target
Regional Opportunity Index for People and Place (score), within the Delta, increases by five percent by 2025.
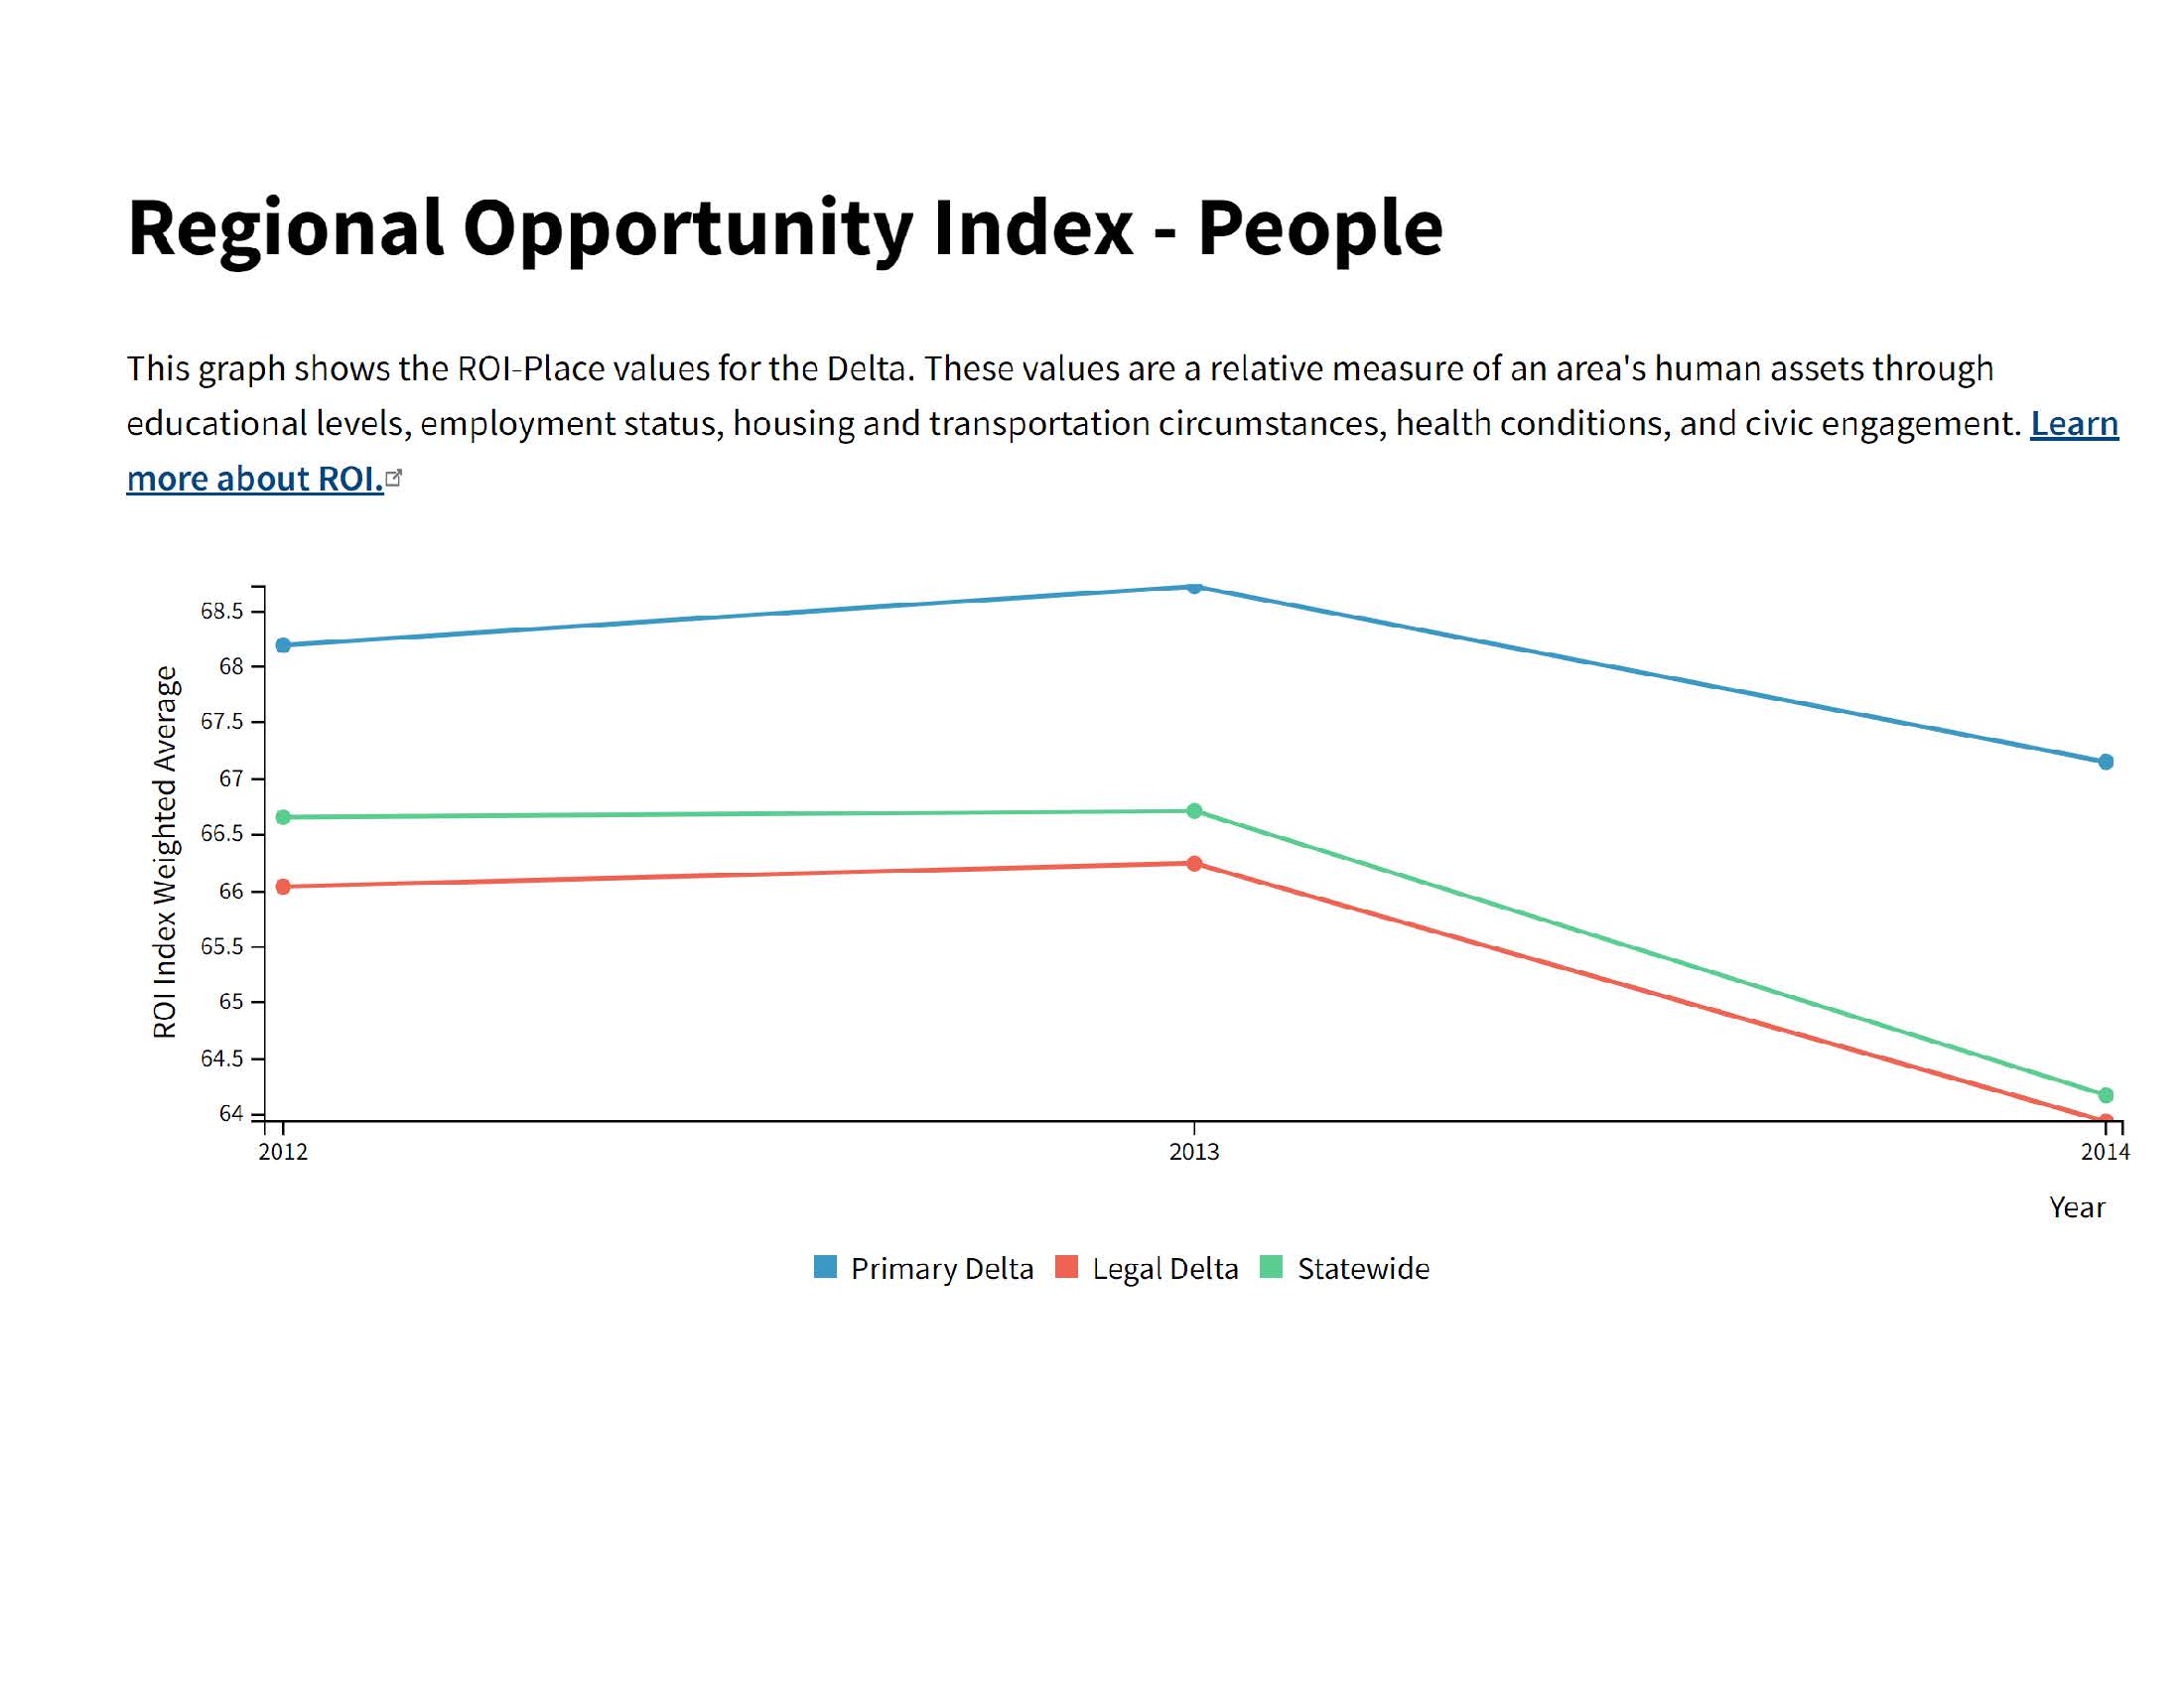
Regional Opportunity Index focused on People that is no longer active
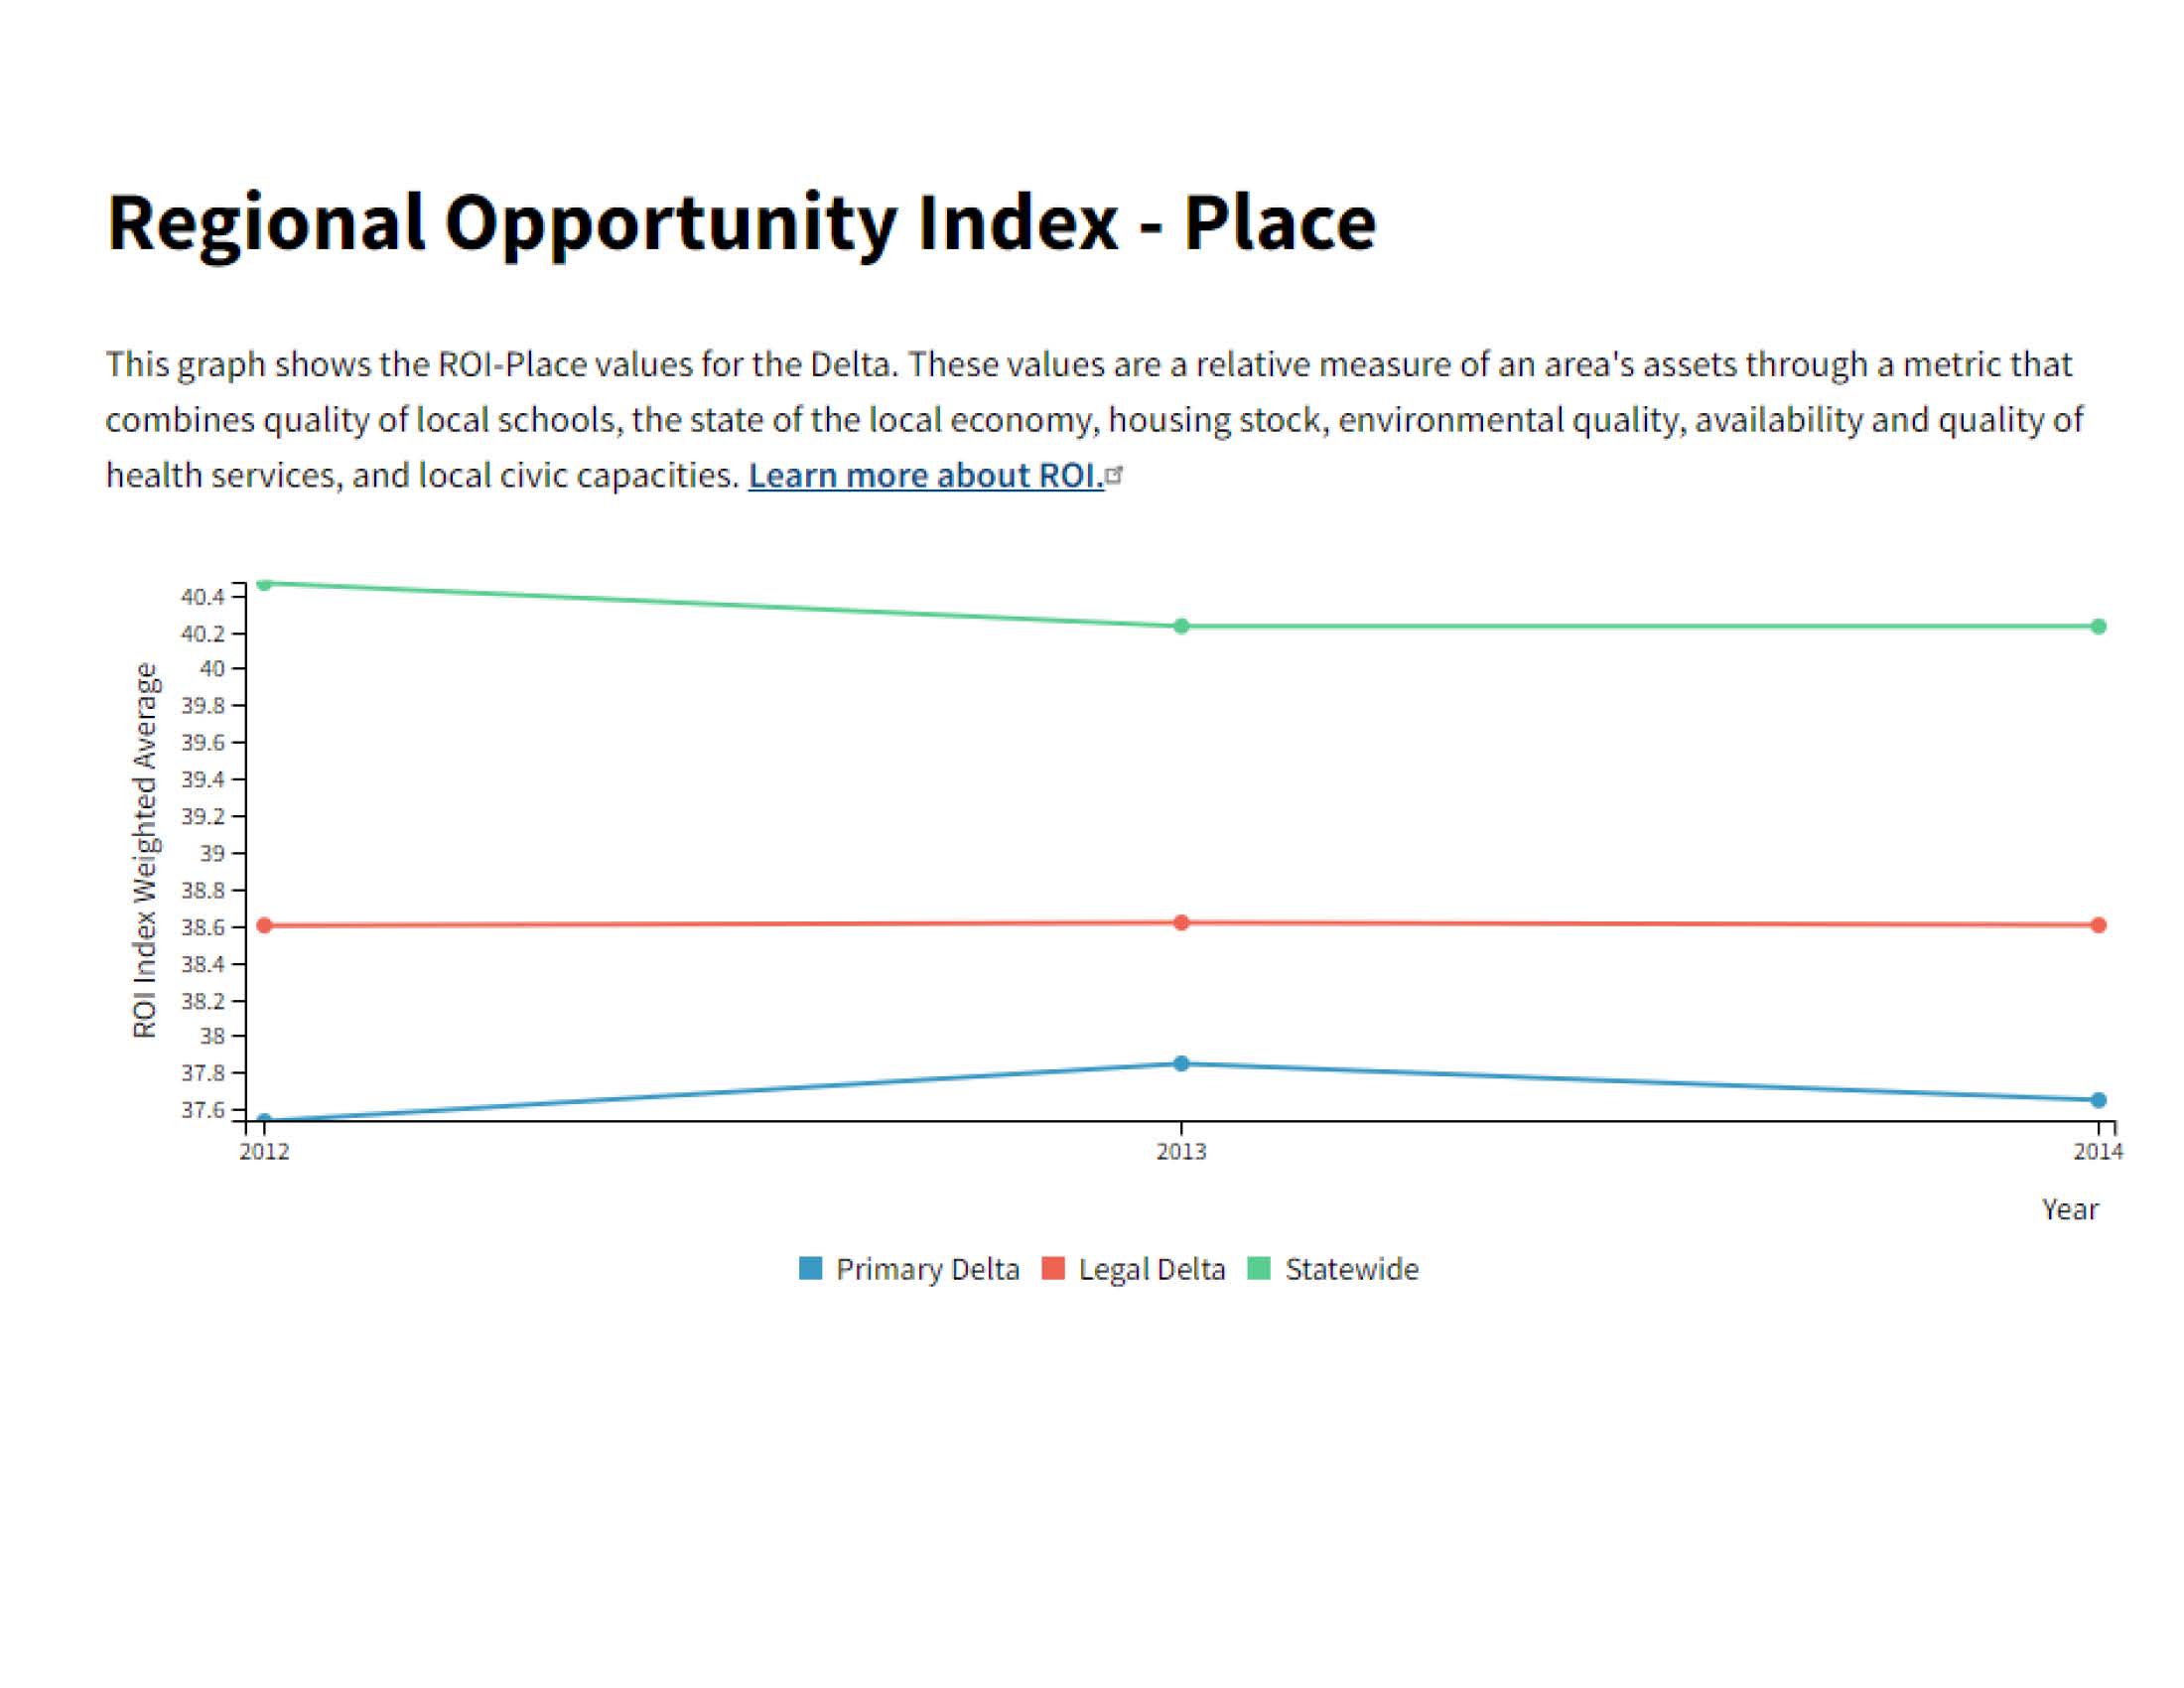
Regional Opportunity Index focused on Place that is no longer active
American Community Survey data - U.S. Census Bureau
Delta Protection Commision - Socioeconomic Indicators Report
Delta Protection Commision - data and code in GitHub
Regional Opportunity Index (ROI), UC Davis Center for Regional Change - Access methodology and data sources
Delta Regional Opportunity Analysis, UC Davis Center for Regional Change - Access the ROI About the Data
The Council will synthesize and report ROI data from UC Davis Center for Regional Change for the Delta to help inform the status in sustaining a vital Delta economy.
For statewide data, weighted averages were calculated by population. For legal Delta values, weighted averages were calculated by population for census areas whose geographic centroid was within the legal Delta. For primary Delta values, weighted averages were calculated by population for census areas whose geographic centroid was within the primary Delta.
UC Davis, Center for Regional Change. Social and Economic Opportunities in the Sacramento-San Joaquin Delta
UC Davis, Center for Regional Change. Delta Regional Opportunity Analysis
UC Davis, Center for Regional Change. Regional Opportunity Index
Socioeconomic Indicators Report: The Sacramento San Joaquin Delta (2019).
Delta Plan Appendix E - Performance Measures for the Delta Plan