A new invasive species, the Golden Mussel, was discovered in the Delta in 2024, threatening natural ecosystems, infrastructure, recreation, and water quality.
The Measure
Prevention and reduction of key invasive non-native terrestrial and aquatic species in the Delta and Suisun Marsh.
-
Expectations
Establishment of new invasive populations is prevented, and already established populations of key non-native invasive species, including fish, plants, and invertebrates are reduced.
-
Performance Metrics
- Number of key new non-native invasive species of fish, plants, and invertebrates
- Non-native fish:
- Percentage of native fish biomass
- Percentage of native fish total relative abundance
- Non-native invasive vegetation:
- Number of acres treated for invasive plants
- Peak coverage of invasive non-native plant species
Non-Native Invasive Species Introductions in the Delta and Suisun Marsh since 2013
Below is a table of non-native invasive species that have been established, confirmed verified sightings in the Delta and Suisun Marsh region.
This list is not meant to showcase all non-native invasive establishments in the Delta but to show specific species that are well-documented and are assessed to have possible major impacts to the Delta ecosystem, waterways, infrastructure, recreation, and / or agriculture. A more comprehensive list is available via the Delta Interagency Invasive Species Coordination (DIISC) Team webpage.
| Common Name | Year Found | Additional Information | |
|---|---|---|---|
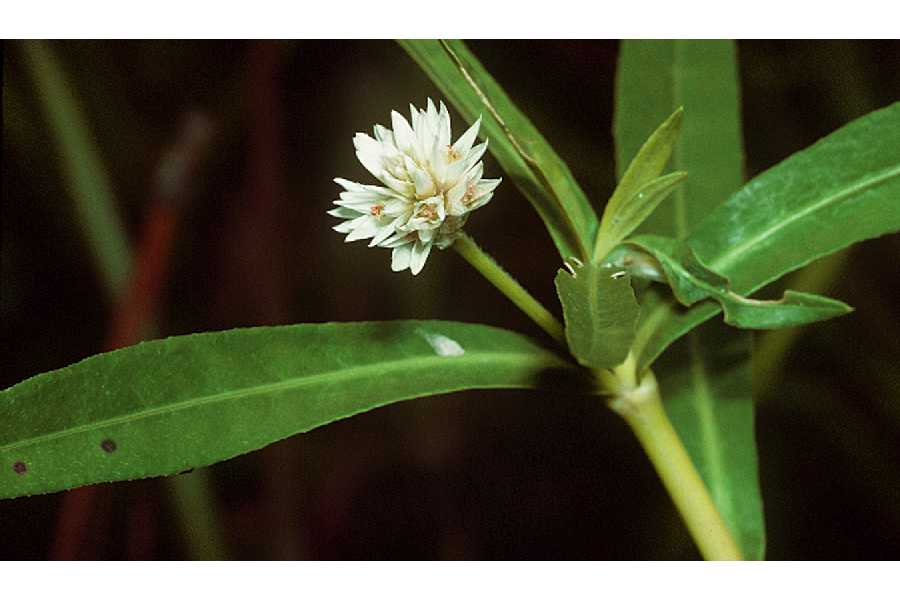 |
Alligator Weed | 2017 | |
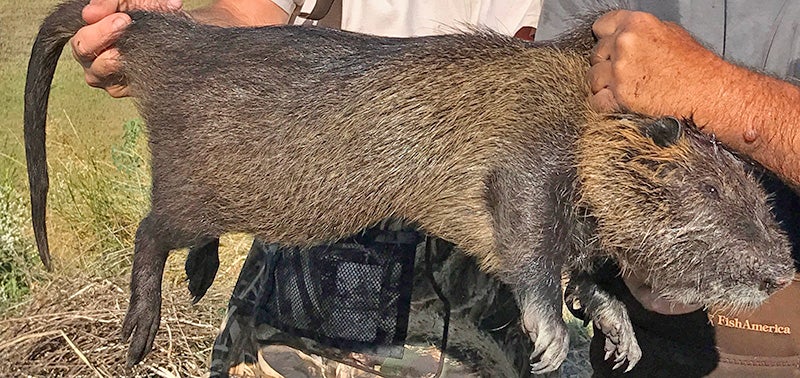 |
Nutria | 2018 | |
|
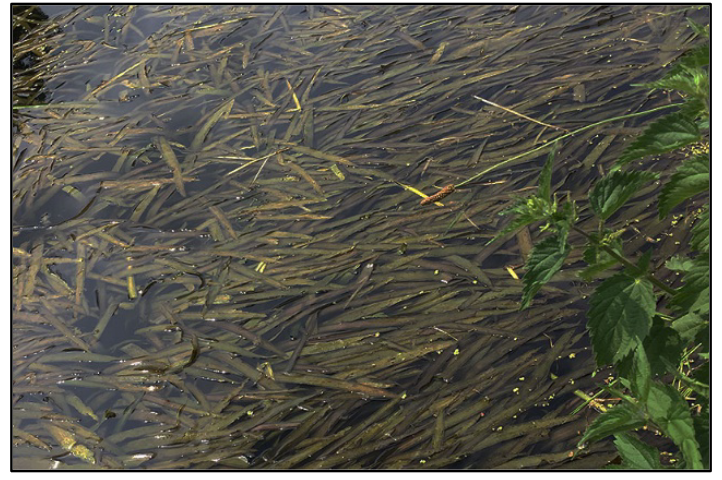
Ribbon Weed | 2021 | |
|
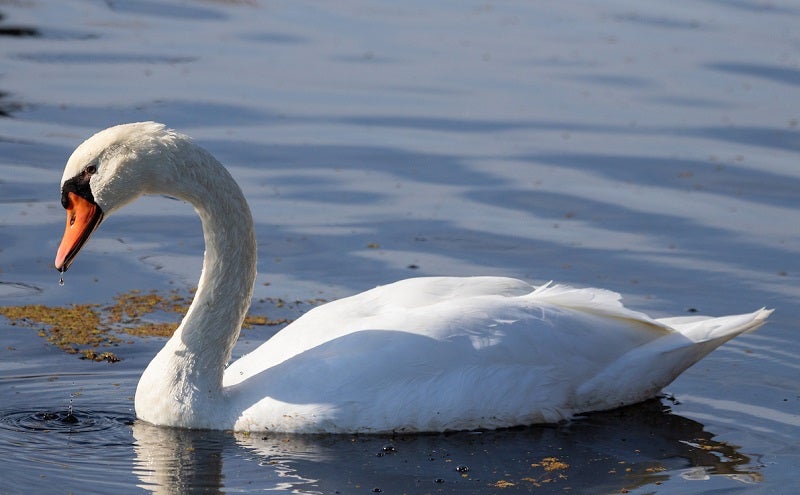
Mute Swan | NA | |
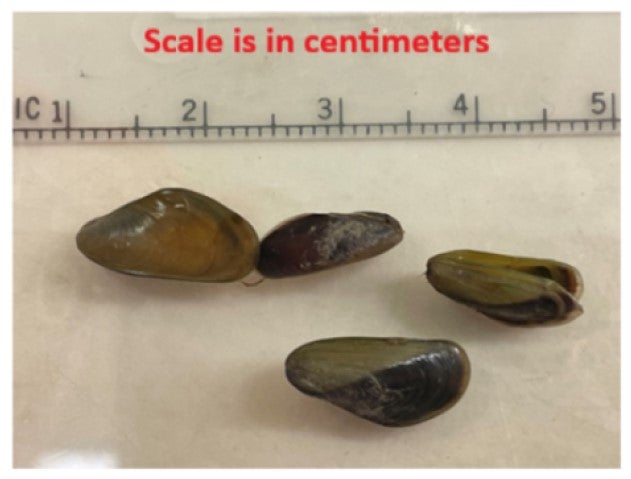 |
Golden Mussel | 2024 |
Nutria eradication efforts:
|
Date |
Total Nutria Take (as of Dec 2025) | Nutria taken from within the Delta and Suisun Marsh (as of Dec 2025) |
|---|---|---|
| Since March 2017 | 7,503 | 2,306 |
| Since January 2025 | 2,076 | 1,092 |
There are several other non-native invasive species established in the Delta and Suisun Marsh. If you are looking for a more comprehensive list of non-native invasive species, they are available at:
- CAL-IPC - provides tools and information regarding California invasive vegetation
- USGS-NAS - a site that is a data repository for spatially referenced biogeographic accounts of introduced aquatic species. It provides several resources such as maps, general information, scientific studies, and etc.
Next Data Update: This will be updated at the start of the new year.
Next Data Update: U.S. Fish and Wildlife Service beach seine survey data are updated about twice a year. The visualization above will be updated in the beginning of each water year in October.
Non-native invasive species are a major stressor to the Delta ecosystem because they affect the survival, health, and distribution of native Delta wildlife and plants. Non-native invasive species can take over habitat space, compete for food, alter food webs, modify the physical habitat structure, and prey upon native species. This may result in non-native plants, invertebrates, and fishes replacing native species, negatively impacting the ecosystem. For example, quagga mussels (Dreissena bugensis) clog water intake structures (e.g., pipes), which can increase maintenance costs. Quagga mussels can also outcompete native mussels and other filter feeding invertebrates for food. Recreational activities on lakes and rivers are also affected as mussels collect on docks, buoys, or boats (may increase drag or clog engines).
Invasive aquatic plants recently have increased in the Delta to an unprecedented level resulting in large-scale accumulation, causing boat navigation obstruction, and impairment of recreation uses of waterways. Invasive aquatic plants also have the potential to damage facilities and threaten the health and stability of fisheries. Five non-native aquatic plants: Brazilian waterweed (Egeria densa), spongeplant (Limnobium laevigatum), curlyleaf pondweed (Potamogeton crispus), water primrose (Ludwigia spp.), and water hyacinth (Eichhornia crassipes), have become particularly problematic in the Delta. To support a healthier and more resilient Delta ecosystem, actions need to be taken to reduce non-native invasive aquatic plants.
Riparian and emergent vegetation types include species such as Arundo donax (giant cane), Phragmites australis (nonnative common reed), Rubus armeniacus (Himalayan blackberry), Lepidium latifolium (perennial pepperweed). Riparian and emergent vegetation type is not included in data visualization yet.
Each chapter of the Delta plan includes strategies to achieve the goals of the plan. These strategies are general guidance on achieving the objective laid out in the plan and in the Delta Reform Act of 2009. Associated with these strategies are recommendations. The recommendations describe more specific and implementable actions to support the achievement of Delta Plan strategies. Strategies and recommendations may also have associated performance measures. Delta Plan performance measures track progress in achieving desired outcomes for the Delta Plan. Below are the strategies and recommendations associated with this performance measure.
Strategy:
-
Prevention and reduction of key nonnative terrestrial and aquatic invasive species in the Delta and Suisun Marsh
Recommendations:
- Regulate angling for non-native sport fish to protect native fish
-
Prioritize and implement actions to control non-native invasive species
Metric to be evaluated annually:
- Number of key new non-native invasive species of fish, plants, and invertebrates establishing populations in the Delta (e.g., Quagga and Zebra mussels, Hydrilla verticillata, and others as they are identified).
Managing non-native fish:
- Percentage of the biomass of fish that are native fish species based on USFWS beach seine surveys (and other relevant surveys).
- Percentage of total relative abundance that are native species in the Delta and Suisun Marsh based on USFWS beach seine surveys (and other relevant surveys).
Managing invasive non-native vegetation:
- Number of acres treated for invasive plants as defined by individual plans and projects (e.g., Central Valley Flood Protection Plan Conservation Strategy, Arundo control project, Division of Boating and Waterways (DBW) aquatic invasive plant control program, etc.).
- Peak coverage, in acres, of invasive non-native plant species (e.g., Eichhornia crassipes, Ludwigia spp., Egeria densa, Arundo donax and Phragmites australis) in the Delta and Suisun Marsh.
Baseline:
- Species reported as established in the Delta prior to 2013 Delta Plan adoption will be used for baseline identification of new invasive species establishing post-2013.
Fish:
- Average percent of total fish biomass that are native fish species based on USFWS beach seine surveys from 1995-2015.
Vegetation:
- Number of acres treated set at zero as of 2013.
- Peak coverage estimates, in acres, for nuisance nonnative aquatic plant species based on available hyperspectral and Landsat remote sensing surveys conducted in the Delta from 2003-2016. Arundo donax surveys conducted for the Delta Conservancy in 2015. Suisun Marsh vegetation surveys conducted from 1999–2013.
Target to be achieved by 2030:
- Zero new nonnative invasive species of fish, plants, and invertebrates established in the Delta.
Fish:
- 20 percent increase in the biomass of the native inshore fish community, relative to total fish biomass.
- 20 percent increase in the relative abundance of the native inshore fish community, compared to total relative abundance.
Vegetation:
- Acreage targets for treatment of invasive plants as defined by individual plans and projects:
- 680 acres within lower Sacramento
- 800 acres within lower San Joaquin
- 15 acres in the Cache Slough Complex (Arundo control project)
- 5,000 acres, annually, for herbicide floating aquatic vegetation treatment in the Delta
- 2,500 acres during treatment seasons for herbicide submersed aquatic vegetation treatment in the Delta.
- A 50 percent reduction in peak non-native invasive plant species coverage (acres), including, but not limited to: Eichhornia crassipes, Ludwigia spp., Egeria densa, Arundo donax, Rubus armeniacus, Lepidium latifolium, and Phragmites australis.
Data are collected and compiled from the following sources:
New Non-Native Invasive Introduction:
California Department of Fish and Wildlife
USGS Non-Indigenous Aquatic Species
California Invasive Plant Council
Fish Biomass and Abundance:
Methods from Mahardja et al. (2017)
U.S. Fish and Wildlife Service beach seine data from the Delta Juvenile Fish Monitoring Program
Data and code used for analysis can be found on the Environmental Data Initiative portal
Relative native biomass and abundance values were calculated as: natives / (natives + non-natives)
Invasive Vegetation Acres Treated:
Department of Boating and Waterways Annual Reports